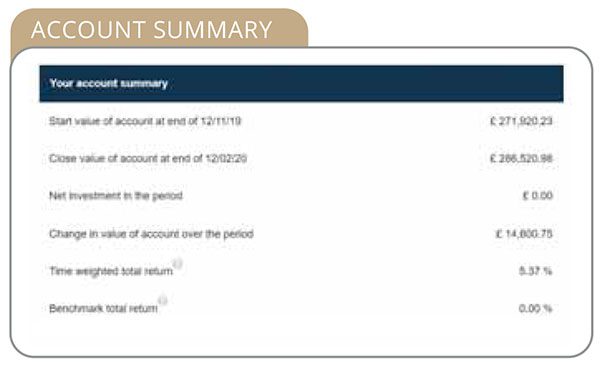

Sitting to the right of the Account Summary is a chart plotting the performance graph of your investment account for the selected period. This is charted as a percentage movement of your account over the selected period.


This chart plots the percentage performance of the selected account (or portfolio) since its start date. The cumulative chart compares the performance of your portfolio against the portfolio’s benchmark.


The last chart sits alongside the Cumulative Performance Graph. This chart shows the Current Cumulative Performance data in a bar chart format for the selected time period and since inception.


Sitting to the right of the Account Summary is a chart plotting the performance graph of your investment account for the selected period. This is charted as a percentage movement of your account over the selected period.


This chart plots the percentage
performance of the selected account (or portfolio) since its start date. The cumulative chart compares the performance of your portfolio against the portfolio’s benchmark.


The last chart sits alongside the Cumulative Performance Graph. This chart shows the Current Cumulative Performance data in a bar chart format for the selected time period and since inception.
Thomas House, 84 Eccleston Square,
London SW1V 1PX
Wealth Management in London is the trading name of Realm Investment Management Ltd. Realm Investment Management Limited is directly Authorised and Regulated by the Financial Conduct Authority under registration number 803673.
The value of your investments can go up as well as down and you may get back less than you originally invested.


Thomas House, 84 Eccleston Square,
Victoria, London SW1V 1PX
Wealth Management in London is the trading name of Realm Investment Management Ltd. Realm Investment Management Limited is directly Authorised and Regulated by the Financial Conduct Authority under registration number 803673.
The value of your investments can go up as well as down and you may get back less than you originally invested.
| Cookie | Duration | Description |
|---|---|---|
| cookielawinfo-checkbox-analytics | 11 months | This cookie is set by GDPR Cookie Consent plugin. The cookie is used to store the user consent for the cookies in the category "Analytics". |
| cookielawinfo-checkbox-functional | 11 months | The cookie is set by GDPR cookie consent to record the user consent for the cookies in the category "Functional". |
| cookielawinfo-checkbox-necessary | 11 months | This cookie is set by GDPR Cookie Consent plugin. The cookies is used to store the user consent for the cookies in the category "Necessary". |
| cookielawinfo-checkbox-others | 11 months | This cookie is set by GDPR Cookie Consent plugin. The cookie is used to store the user consent for the cookies in the category "Other. |
| cookielawinfo-checkbox-performance | 11 months | This cookie is set by GDPR Cookie Consent plugin. The cookie is used to store the user consent for the cookies in the category "Performance". |
| viewed_cookie_policy | 11 months | The cookie is set by the GDPR Cookie Consent plugin and is used to store whether or not user has consented to the use of cookies. It does not store any personal data. |

